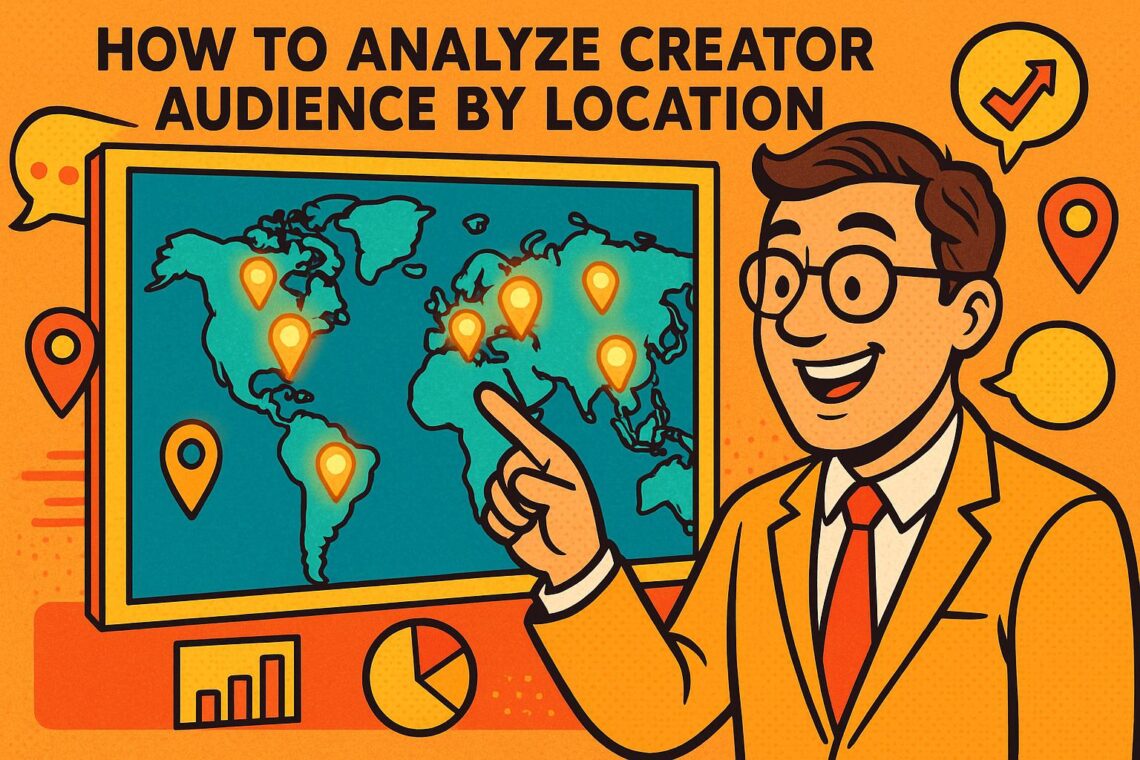
Want to boost campaign results? Start by understanding where a creator’s audience lives. Knowing your target regions – whether it’s states, cities, or neighborhoods – helps you focus your marketing efforts where they matter most. Here’s why location analysis is essential and how to do it:
- Why it matters: Campaigns targeting specific locations often see better engagement and ROI. For example, creators with U.S.-focused audiences can achieve up to 20% higher engagement on sponsored content.
- What to track: Top metrics include audience location (by state or city), engagement rates, and spending patterns.
- Tools to use: Platforms like Instagram Insights or advanced analytics tools like NimbusReach provide detailed location breakdowns, helping you identify high-value regions and engaged audiences.
- Steps to take:
- Collect location data from native or third-party tools.
- Analyze trends to find regions with high engagement or spending power.
- Use visual reports (like heatmaps) to make data actionable.
How To Check Influencer Audience Demographics In 30 Seconds
Key Metrics and Tools for Location Analysis
Knowing which metrics to track and where to source reliable location data can completely change how agencies approach partnerships with creators. The right tools not only reveal where fans are located but also highlight how engaged and valuable they are in different regions.
Important Location Metrics to Track
Key geographic metrics – like top countries, states, cities, engagement rates, and spending patterns – offer insights into where audiences are most impactful. For example, an analysis of OnlyFans fan spending trends in 2025 revealed significant regional differences that directly shape the creator economy. Smaller audiences in certain areas can often outperform larger ones when engagement and spending are taken into account.
It’s also essential to monitor audience authenticity. Comparing engagement rates with follower growth can help ensure you’re targeting genuine, active communities. By focusing on these metrics, agencies can identify the best regions to prioritize and the most reliable data sources to use.
Where to Find Location Data
There are several sources for location data, each offering unique insights. Native analytics tools, such as those on OnlyFans and Instagram, provide direct audience breakdowns. For instance, Instagram’s Audience tab offers detailed follower location data along with demographic and activity insights.
Beyond platform-native tools, third-party analytics platforms can provide more detailed breakdowns and real-time tracking. These tools often come with fraud detection features to weed out fake followers, ensuring the data is accurate. Combining native and third-party tools can improve data precision, setting the stage for advanced platforms like NimbusReach to deliver even deeper insights into regional audience value.
How NimbusReach Helps Agencies
NimbusReach specializes in supporting OnlyFans and Instagram creators with tools designed to prioritize audience quality over sheer numbers. One standout feature is its proprietary Fan Devotion Score, which uses web-wide signals to identify creators whose audiences are not only large but also highly engaged and willing to spend. This makes geographic targeting more effective and profitable.
NimbusReach offers three subscription plans to accommodate agencies of different sizes:
- Starter Plan ($25/month): Includes 250 profile views, advanced search filters, and CSV export options.
- Growth Plan ($50/month): Expands to 1,000 profile views and adds growth alerts for tracking creator performance.
- Pro Plan ($150/month): Provides 5,000 profile views, dedicated support, and content ideation tools for larger operations.
What sets NimbusReach apart is its dual focus. It doesn’t just identify creators with followers in specific regions; it also assesses the quality of those audiences. This means agencies can zero in on creators whose regional audiences show high levels of engagement and spending potential. Features like bulk export tools and growth alerts allow agencies to monitor geographic trends over time, uncover new markets, and adjust strategies as needed – all in real time.
Step-by-Step Guide to Location Analysis
Building off the earlier discussion about the importance of geographic data, this guide walks you through how to turn raw location information into practical marketing strategies. It’s a three-phase process that takes scattered data and transforms it into clear, actionable insights.
Collecting and Organizing Location Data
Start by gathering data from native analytics tools like Instagram Insights or YouTube Analytics. These platforms provide direct access to audience location breakdowns, and most allow you to export this data as CSV files for more in-depth analysis.
Once exported, clean and standardize the data. Use U.S. formats for consistency – state abbreviations (e.g., CA, NY) and dates in MM/DD/YYYY format. Ensure city names and other entries are uniform to avoid discrepancies during analysis.
If you’re looking to save time, third-party tools can streamline this process. For instance, NimbusReach lets you export detailed audience location and engagement reports, complete with advanced filters. These tools can help you quickly identify creators with strong regional audiences and potential for monetization.
With your data cleaned and organized, you’re ready to uncover trends.
Finding Trends and High-Value Regions
The next step is analyzing your data to pinpoint regions with the greatest potential. Instead of focusing solely on follower counts, prioritize engagement rates by location. For example, 1,000 highly engaged followers in Texas can be far more valuable than 5,000 passive followers spread across multiple states.
Use pivot tables to break down metrics by city or state and compare engagement rates, conversion rates, or other key performance indicators. Look for patterns like stronger engagement in metropolitan areas or specific states where past campaigns have excelled. Pair this location data with revenue metrics, such as average order values, to identify regions with higher spending potential.
Mapping your audience distribution can also reveal valuable clusters. For instance, if you notice strong engagement in the Southeast or Pacific Northwest, you can focus your efforts on creators with an established presence in those areas. Smaller cities with high engagement shouldn’t be overlooked either, as they can offer untapped opportunities.
Creating Visual Reports for Better Insights
Once your analysis is complete, transform the data into clear, visual reports for easy interpretation. Bar charts are great for comparing audience sizes across regions, while heatmaps are ideal for showing engagement density by state.
Include summary tables that highlight key metrics like engagement rates, conversion rates, and average spending per location. Make sure everything is formatted consistently – use USD ($) for currency, commas for thousands (e.g., 1,000), and MM/DD/YYYY for dates.
Keep your visuals straightforward and well-labeled. Each chart should answer a specific question, such as, “Which states generate the highest conversions?” or “Where should we focus our next campaign budget?” Tailor the level of detail in your reports to your audience: executives may prefer high-level overviews, while campaign managers might need more granular breakdowns.
These visualizations bring clarity to your findings. For example, if your reports show that audiences in California and New York have conversion rates 25% higher than other regions, you can confidently prioritize creators with strong followings in those areas. This kind of targeted strategy ensures your marketing efforts are both efficient and effective.
sbb-itb-bd3d2dc
Best Practices for Using Location Data
Turning raw location data into actionable insights is just the beginning. To truly maximize the potential of this data, it’s important to follow practices that ensure precision, compliance, and strategic targeting. Success lies in balancing data-driven strategies with ethical considerations and a nuanced understanding of regional dynamics.
Privacy and Data Compliance
When working with location data, adhering to privacy laws isn’t optional – it’s essential. In the U.S., the California Consumer Privacy Act (CCPA) sets strict guidelines on how personal information, including geographic data, can be collected and used. Under this law, you’re required to provide clear privacy policies explaining how location data will be used, while also giving users the ability to access or delete their information.
To simplify compliance, consider using tools like NimbusReach, which offers features designed to keep your data practices within legal limits. Platforms like this ensure that data collection aligns with U.S. privacy regulations, allowing you to focus on insights without risking legal missteps.
Explicit user consent is another non-negotiable. Always explain – in plain, straightforward language – what data you’re collecting and why. Make sure users actively opt in, rather than relying on vague or hidden terms. Once you’ve collected the data, store it securely and limit access to only those team members who need it for campaign planning. Regularly auditing your data practices will help you stay ahead as privacy laws evolve across different states.
Focusing Campaigns on High-Value Regions
When it comes to campaign success, quality trumps quantity. Instead of chasing sheer follower numbers, prioritize engagement and focus on regions that offer the most business potential. A 2024 survey found that 68% of U.S. agencies consider audience location data "very important" for campaign planning, with 54% reporting higher ROI when using location-based targeting.
For example, a creator with 10,000 highly engaged followers in Texas could deliver better results than one with 50,000 passive followers scattered across the country. Metrics like conversion rates, average order values, and engagement levels can help you identify and rank regions by their potential impact on your goals.
Once you’ve pinpointed high-performing regions, adjust your budget accordingly. If data shows that certain areas yield better results, allocate more spending to creators with strong followings in those regions. Research from Placer.ai suggests this targeted approach can boost campaign effectiveness by up to 20%.
Don’t overlook seasonal trends, either. Campaigns with Florida-based creators might thrive in the summer, while winter-themed content could resonate more with audiences in northern states like Minnesota or Michigan. These insights allow you to tailor your campaigns to specific regions and seasons for maximum relevance.
Adapting to U.S. Regional Preferences
The U.S. is a patchwork of regional identities, each with its own preferences and values. For instance, audiences in the Northeast often appreciate efficiency and direct messaging, while Southern audiences may respond better to community-focused content. On the West Coast, sustainability and innovation tend to resonate, whereas Midwestern audiences often favor practical, family-oriented themes.
Timing your campaigns around regional holidays and local traditions can also make a big difference. Independence Day content might work nationwide, but events like Mardi Gras in Louisiana offer opportunities for hyper-localized campaigns. Similarly, beach-themed promotions may appeal year-round in places like Southern California and Florida, but they’ll likely only resonate with Northeast audiences during the summer. Adjusting your content calendar to reflect these nuances can help your campaigns feel more relevant.
Language and cultural references are equally important. A creator who uses regional slang or mentions local landmarks will come across as more authentic to their audience, which can lead to stronger engagement and deeper brand connections.
Testing is key to finding what works. Messaging that performs well in urban areas like New York City might fall flat in rural parts of the same state. Use A/B testing to experiment with different approaches and track performance across regions. Over time, you can build a playbook of strategies tailored to each market.
The secret to success is treating each region as a distinct market. A one-size-fits-all strategy rarely works in a country as diverse as the U.S. By tailoring your approach to the unique characteristics of each region, you’ll set yourself apart from competitors and create campaigns that truly resonate.
Conclusion: Growing with Geographic Audience Data
Using geographic audience data can turn raw information into strategies that boost revenue. In 2025, the creator economy will be shaped by regional differences in fan spending and engagement. This makes location insights a critical tool for agencies aiming to maximize returns. For example, location-based targeting can improve campaign ROI by up to 30%, compared to campaigns without such focus. Additionally, 72% of marketers view geographic data as crucial for planning and measuring influencer campaigns.
One major takeaway is that superfans – those highly engaged and loyal followers – are often concentrated in specific regions. This means targeted outreach in those areas can yield far better results than casting a wide net. Agencies should prioritize creators with strong, devoted audiences in high-value locations to make the most of their efforts.
Platforms like NimbusReach make it easier to identify these opportunities. With tools like its advanced analytics and Fan Devotion Score, the platform helps pinpoint creators who have genuine, paying fans in specific regions. These insights reveal regional trends and growth patterns that might otherwise go unnoticed, enabling smarter decisions on where to allocate resources and budgets.
The rise of hyper-local influencer marketing is gaining momentum, driven by AI-powered analytics. These tools don’t just show where audiences are – they highlight where the most engaged and highest-spending fans are located. This shift underscores the importance of understanding regional preferences and local spending habits for staying competitive.
Consistently updating your location data is another key to success. Regularly analyzing this data helps you stay ahead of shifting trends and audience movements. By focusing budgets on regions with high engagement, agencies can achieve measurable growth.
Agencies that make the most of geographic insights are better positioned to thrive in today’s creator-driven economy. With the right tools, compliance processes, and regional strategies, location data becomes a powerful guide to finding the creators and audiences that will fuel long-term success.
FAQs
How can I make sure location data is accurate and respects privacy laws?
To keep location data precise and aligned with privacy regulations, it’s important to analyze creators who have authentic, engaged audiences. Leveraging tools with in-depth analytics and sophisticated filtering options can help pinpoint creators whose audience data is dependable and aligns with your goals.
Platforms such as NimbusReach make this process easier by providing insights into audience engagement and geographic patterns. This allows you to verify location data accuracy, adhere to privacy standards, and ensure you’re connecting with the right creators for your campaigns.
What are the benefits of using geographic audience data in influencer marketing?
Understanding geographic audience data can make influencer marketing campaigns much more impactful. By examining where a creator’s followers are based, you can shape campaigns to connect with specific regions, aligning your message with local interests, customs, and trends.
This approach doesn’t just boost relevance – it also ensures smarter use of your ad budget. For instance, if a creator has a large audience in California, focusing efforts on that region with location-specific promotions or services can lead to stronger engagement and higher conversions. Plus, these insights can help brands uncover new markets and fine-tune their outreach strategies to achieve even better results.
How can I identify regions with the most engagement and spending potential for my campaigns?
To identify areas with the most engagement and spending potential, dive into your audience demographics using advanced tools. These tools can reveal valuable insights, such as geographic locations, engagement levels, and spending habits. Pay attention to regions showing high activity or consistent purchasing trends.
Using detailed analytics and filtering options, you can zero in on the locations where your campaigns are likely to perform best. This allows you to allocate resources more effectively and create a targeted outreach strategy that delivers stronger results. A data-driven approach ensures your efforts are focused where they matter most.